- takiya_
- moneyfx advance
 Offline
 - Registered: 9/11/2013
- Posts: 233
Re: signal XAG-USD-(Silver)

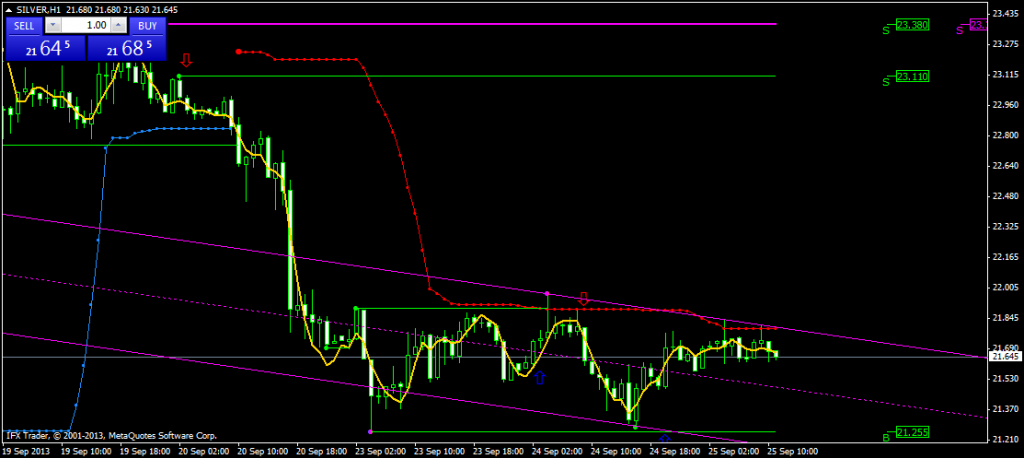
Suspended twice in the resistance area at a price 21.8, SILVER Samai at least have a chance down the middle level price SHI channel to 21:37. Furthermore, SILVER has probably dropped to 21,255 levels if the level of the midpoint is quite clear break with
- sara59852
- moneyfx advance
 Offline
 - Registered: 9/12/2013
- Posts: 125
Re: signal XAG-USD-(Silver)

Silver managed to rise above the pivot level, despite efforts to get back down below the pivot. If Silver is able to sustain above the pivot position, Silver will likely strengthen to 22:00 until 22:34, but if the price back down below the pivot, Silver will likely fall to as low as 21:31 until 20.95
- •
- sara59852
- moneyfx advance
 Offline
 - Registered: 9/12/2013
- Posts: 125
Re: signal XAG-USD-(Silver)

Silver tried to get down below the support level 1, if successful, likely silver will continue to go down to 21:32 or lower level, but if it fails, silver will probably go back to pivot even perhaps to the level of 21.96.
- •
- takiya_
- moneyfx advance
 Offline
 - Registered: 9/11/2013
- Posts: 233
Re: signal XAG-USD-(Silver)

TFH4 Bullish Trend
Gap that occurs immediately closed up the price and the current price is in the 76.4% FR
Lowest Price fibo can test the limits, as the weakening of the target price.
- surya
- moneyfx advance
 Offline
 - Registered: 9/12/2013
- Posts: 102
Re: signal XAG-USD-(Silver)
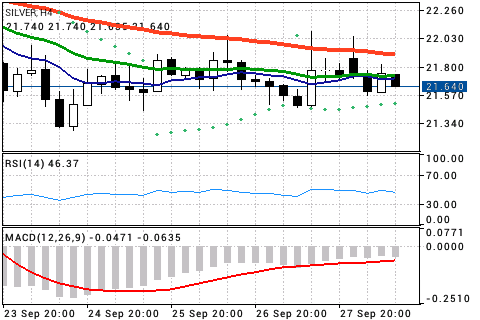
Silver Technical Analysis
Silver: SELL
BID PRICE 21.64
EXPONENTIAL MA 20 21.70 SELL
EXPONENTIAL MA 50 21.72 SELL
EXPONENTIAL MA 100 21.90 SELL
PARABOLIC SAR BUY 0.02/0.2 21:50
RSI 14 46.37 SELL
MACD 12,26,9 -0.0471 SELL
Support: 21:56
Pivot: 21.80
Resistance: 22:04
Trend: Bearish.
- sara59852
- moneyfx advance
 Offline
 - Registered: 9/12/2013
- Posts: 125
Re: signal XAG-USD-(Silver)

On the daily chart, silver is actually still in a bearish pattern since 29 Agst'13 and have not seen a reversal pattern to date. Today in H1 chart, silver managed to fall below the pivot level, likely will go down to 21:44 or lower level, but if silver rises above the pivot back, there is likely to rise to level again 22:07.
- •
- takiya_
- moneyfx advance
 Offline
 - Registered: 9/11/2013
- Posts: 233
Re: signal XAG-USD-(Silver)

Time Frame 4 H
indicator = DE MARK TREND LINE TRADER (COMBINED fractals, TREND LINE, PIVOT POINT, LINE TRIGGER)
reason = though appearing bullish candle pair several times but can not increase further over the line de mark green trend but remains in consolidation narrows between the two trend lines de red and green mark
- surya
- moneyfx advance
 Offline
 - Registered: 9/12/2013
- Posts: 102
Re: signal XAG-USD-(Silver)
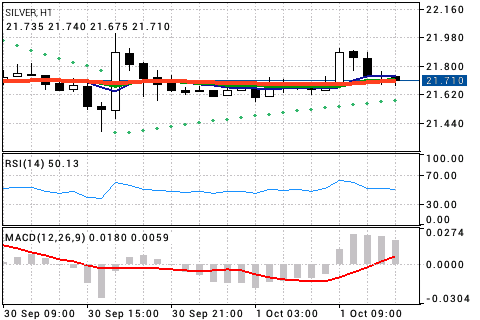
Silver Technical Analysis
Silver: SELL
BID PRICE 21.71
EXPONENTIAL MA 20 21.73 NEUTRAL
EXPONENTIAL MA 50 21.71 NEUTRAL
EXPONENTIAL MA 100 21.70 NEUTRAL
PARABOLIC SAR BUY 0.02/0.2 21:58
RSI 14 50.13 NEUTRAL
MACD 12,26,9 0.0180 BUY
Support: 21:57
Pivot: 21.74
Resistance: 21.91
Trend: Sideways.
- takiya_
- moneyfx advance
 Offline
 - Registered: 9/11/2013
- Posts: 233
Re: signal XAG-USD-(Silver)

Time Frame 4 H
indicator = DE MARK TREND LINE TRADER (COMBINED fractals, TREND LINE, PIVOT POINT, LINE TRIGGER)
reason = although the pair at the center consolidation narrows between the two trend lines de red and green marks but still dominated candle that appears bullish candle so the pair will still be close to the mark as the bullish pivot de
- takiya_
- moneyfx advance
 Offline
 - Registered: 9/11/2013
- Posts: 233
Re: signal XAG-USD-(Silver)

Time Frame 4 H
indicator = DE MARK TREND LINE TRADER (COMBINED fractals, TREND LINE, PIVOT POINT, LINE TRIGGER)
reason = strong bullish engulfing candle held above the pivot de green mark when it was still a powerful means the pair will be a strong bullish but if not then there will be a sharp bearish
- takiya_
- moneyfx advance
 Offline
 - Registered: 9/11/2013
- Posts: 233
Re: signal XAG-USD-(Silver)

Time Frame 4 H
indicator = DE MARK TREND LINE TRADER (COMBINED fractals, TREND LINE, PIVOT POINT, LINE TRIGGER)
reason = pair moving in the direction of movement of the green trend line de mark as bearish candle bullish despite appearing a few times but not too strong to penetrate the trend line as a bullish acceleration mode
